Has Social Media Got Georgia On Its Mind?
With the presidential election behind us (or most of us, at least) all eyes have turned to Georgia and the Senate run-off elections, as they will decide which party will eventually have control of the Senate – and, of course, which candidates will better defend Georgia’s interests in Washington. In this article we take a closer look at the social media pages of the candidates.
Since Obama’s reelection in 2013, researchers have used social media to try to understand and forecast election results. Obama’s campaign in 2012 was a milestone in how to use social media to mobilize its base, but at that time social media was not yet used extensively to compare candidates. Trump’s campaign in 2015 stepped up the use of social media to new levels. In 2015, we also saw the use of fake news as an effective way of spreading disinformation, and that applies in different degrees to sympathizers of both parties. Since then, candidates across the board have become more aware of the importance of social media, and started using them a lot more. Considering that a large percentage of the US population (79% in 2019 according to Statista) is active on social media, what the fans and followers say on social media has become an important indicator of trends among the electorate.
Research has shown that many people feel more at ease expressing their personal views online than when talking to a pollster. That happens because the person may be embarrassed to openly support a more controversial candidate, or because of lack of trust in the institutions responsible for the polling (How pollsters could use social media data to improve election forecasts). The opinions expressed on social media tend to be more polarizing and less susceptible to social norms that may prevail in the family or work environment.
Social media played an even more significant role in this year’s elections. Due to the pandemic, big rallies were avoided by most candidates, who had to rely on social media to divulge their platforms and bring new sympathizers to their side.
This blog post analyzed the social media accounts of the four candidates to the Senate in Georgia’s runoff elections on January 5th, 2021. We used the Odysci Media Analyzer to monitor daily the social media pages on Facebook and Twitter of Jon Ossoff (D), David Perdue (R), Reverend Raphael Warnock (D) and Kelly Loeffler (R). We monitored Facebook and Twitter because these are the social networks most used by the candidates, although they all have Instagram and YouTube accounts as well. The data reported here were collected for two weeks between November 23rd and December 7th.
Fans and Followers
To start off, let’s have a look at the plain sizes of fans and followers of each candidate’s social media pages. The numbers were collected on December 7th at 8am.
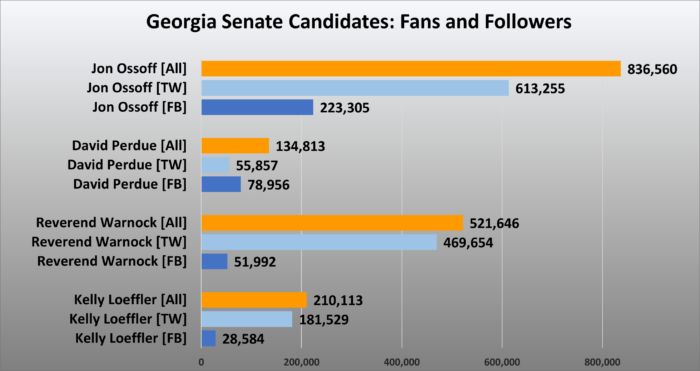
The figure above shows Jon Ossoff leading in the overall number of Facebook fans and Twitter followers with just over 836 thousand, and Ossoff also leads separately on Facebook and Twitter. Reverend Warnock takes 2nd place in overall numbers, 2nd on Twitter and 3rd on Facebook. Kelly Loeffler is 3rd overall, 3rd on Twitter and 4th on Facebook. Finally, David Perdue is 4th in overall fans and followers, although he is 2nd on Facebook. Perdue is also the only candidate who has more Facebook fans than Twitter followers.
The overall number of fans and followers changes daily, but it does not say much about the rate in which new fans and followers are obtained, nor does it say anything about their engagement with the candidate. For that, we will now look at how many fans and followers each candidate gained in the last two weeks, as well as the amount of engagement that the candidates’ posts and tweets received.
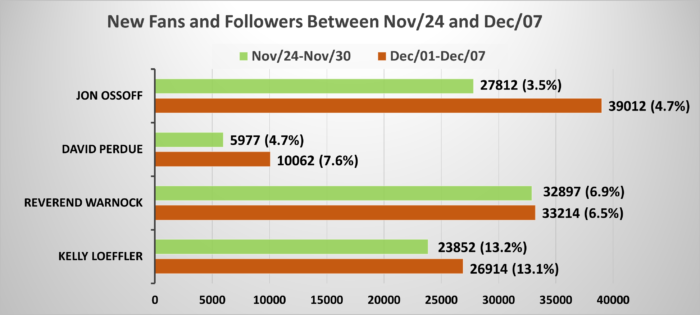
The figure below shows the number of fans and followers that each candidate gained in each of the past two weeks, and the percentage increase represented over the base number starting each week. Here we can see that Warnock gained the most fans and followers in the week of Nov/24-10, with Ossoff in second; whereas Ossoff was the winner in the week of Dec/01-07 with Warnock in second. However, in terms of percentage increase we saw Kelly Loeffler leading with a 13.3% increase in the first week, and 13.1% increase in the second week.
It is also important to compare the percentage of new fans and followers going for each candidate. For example, for each 100 new people who started following any of the candidates, how many followed each candidate? The following figures look into these numbers pairwise for each senate race.
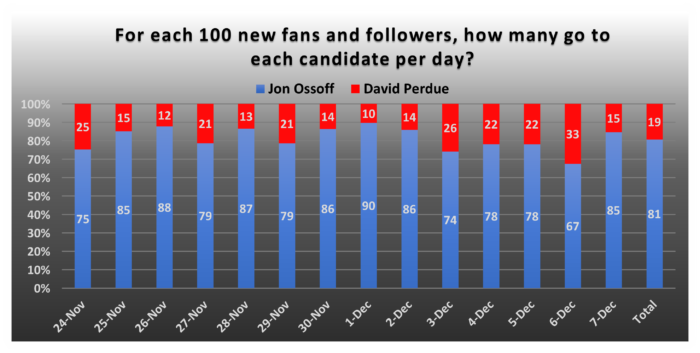
The figure above breaks down the distribution of new fans and followers for both candidates, Jon Ossoff (D) and David Perdue (R), between November/24 and December/7, as well as the total in the period. For example, on Nov/26, for each 100 new fans and followers we had 88 following Jon Ossoff (D) and 12 following David Perdue (R). Overall, for the 2 weeks, for each new 100 fans and followers, 81 sided with Jon Ossoff (D) and 19 sided with David Perdue (R).
Although there are a few daily variations, the overwhelming majority of new social media fans and followers are going for Jon Ossoff. We saw a small decrease in number on Dec/6, possibly explained by a boost to Perdue from Trump’s rally on Dec/5; only to see a bump in the numbers again on Dec/7, possibly explained by the debate in which Perdue was a no-show and Ossoff had all the coverage.
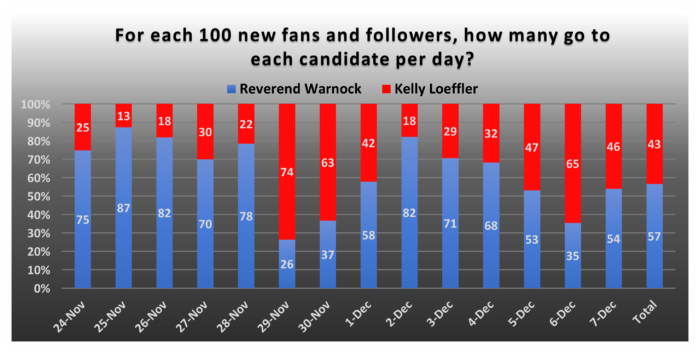
The figure above shows the same metric for candidates Reverend Warnock (D) and Kelly Loeffler (R). For example, on Nov/28, for each new 100 fans and followers we had 78 following Reverend Warnock (D) and 22 following Kelly Loeffler (R), but on Dec/6 we had 35 for Reverend Warnock and 65 for Kelly Loeffler. In this race, we see strong fluctuations from one day to the next and it’s unclear why. Overall, for the 2 weeks, for each new 100 fans and followers, 57 sided with Reverend Warnock (D) and 43 sided with Kelly Loeffler (R).
Engagement
Engagement is a measure of how much the fans and followers interact with the social media pages of the candidates. This interaction may vary from simply looking at the candidates’ page, to liking a page, post or tweet, to writing a comment, to sharing the post or retweeting it. Here we will measure engagement based on the number of comments that fans and followers produce in association with a candidate’s social media page. Just to clarify the methodology: we count as a comment when someone posts something on the candidate’s Facebook page; when someone writes a tweet containing a mention @candidate-page; or when someone re-tweets something the candidate had tweeted.
The figures below show the total number of posts and tweets, as well as the total number of comments (as defined above) received by each candidate in the two weeks considered (Nov/24-Dec07). Kelly Loeffler posts the most, especially on Twitter. In second place comes Jon Ossoff, followed by Warnock and Perdue. On the receiving side, we see a different picture with Jon Ossoff way in front on Twitter having received more than 100 thousand mentions and retweets. Warnock comes second with over 60 thousand. Kelly Loeffler is third, followed by Perdue in fourth. On Facebook alone, Perdue has the lead in number of comments received.

More important than the absolute number of comments received, is the ratio of comment-per-post, and comment-per-post-per-1000-fans. Usually, candidates that post more will receive more feedback, and the same is true for pages with more more fans and followers. Thus, to be able to compare we need to compute the ratios of comments per post/tweet, and comments per post/tweet per 1000 fans/followers, as shown below (note that by “comments” we mean comments, mentions, replies and retweets).

These figures show a few interesting aspects. On Facebook, Perdue has more engagement than the others. He posted less than the others but received a larger number of comments, making his Facebook metric Comments-per-Post the highest, followed by Loeffler. But once we divide by the number of fans, Loeffler’s engagement shoots up (to 10.7), mainly because Loeffler has the fewest number of Facebook fans. On Twitter, Ossoff and Warnock have the highest Comments-per-Post metrics, but that goes down once we divide by their larger number of followers.
Another interesting aspect of engagement, especially in politicians’ pages, is that the people who comment on the page or add a @mention to the candidate are not necessarily supporting the candidate. This means that having received a significant number of comments, or having high engagement does not necessarily represent support for whatever the candidates posted.
What They Said and What They Heard
The words used by the fans and followers in their comments on Facebook and mentions on Twitter are excellent indicators of the topics most relevant to the users tuned to the candidates’ social media pages. Candidates who are responsive to their constituencies should pay close attention to that. Moreover, it is also important to correlate what the candidates post with what their fans comment.
Using the Odysci Media Analyzer we mined the most frequent terms in the candidates’ posts and tweets, as well as in the comments, replies and retweets of their fans and followers. A word on methodology, for each post or tweet, we analyzed up to 500 comments, replies or retweets. Most posts and tweets have fewer than 500 comments, but when they exceeded this number, we collect 500 of them for this analysis. When collecting the frequent terms, we counted together terms with similar meaning, for example, “corrupt” and “corruption” were counted together. Finally, we also removed certain terms which tend to have very high frequencies, such as, the candidates’ names, ‘Georgia’, ‘Trump’, ‘Senate’, and other politicians’ names. This was done in order to let the actual words representing issues important to Georgians appear closer to the top.
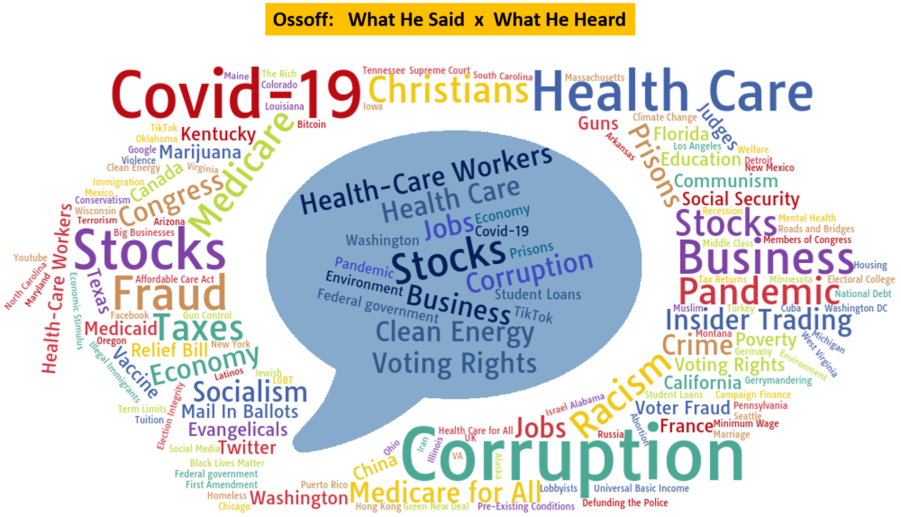
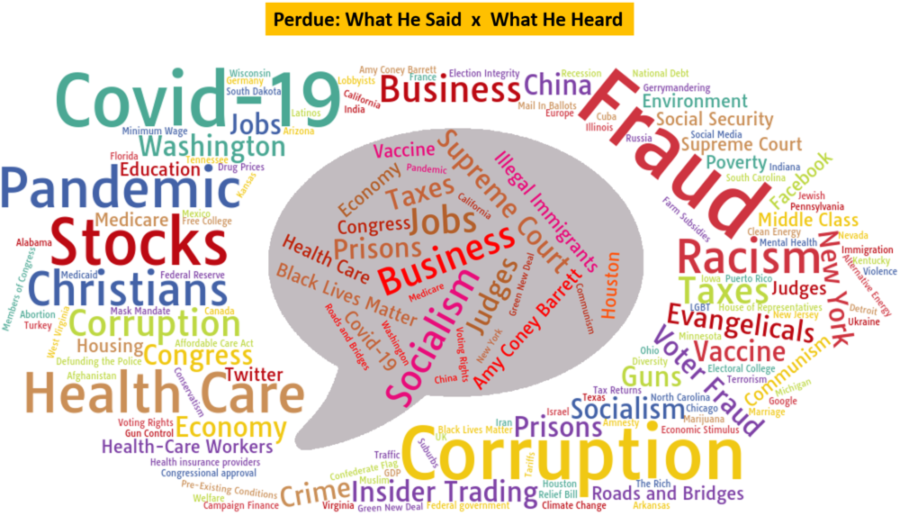
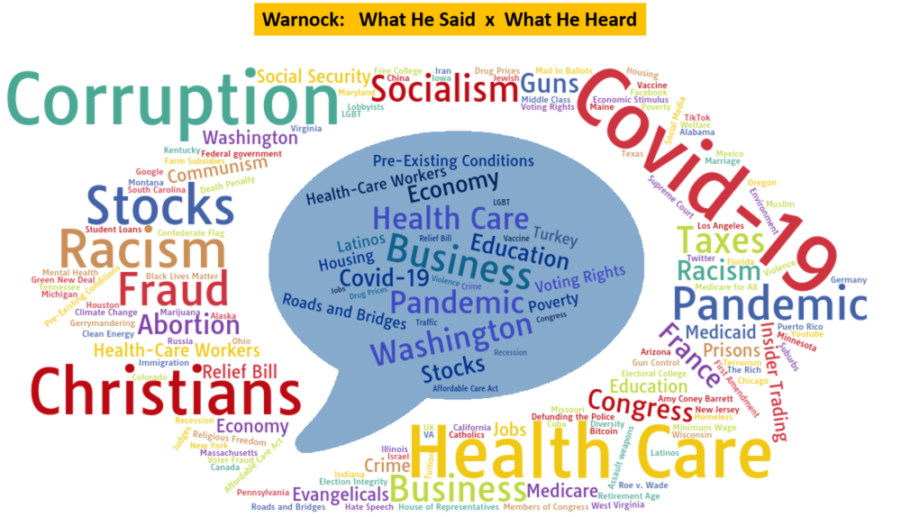
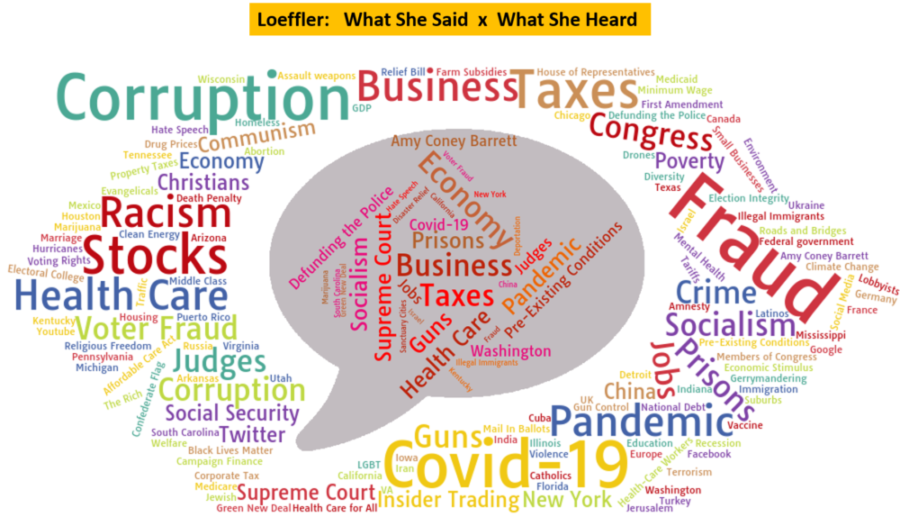
To visualize these frequent terms, we created word clouds, where the inner cloud contains the words most frequent in the candidate’s posts and tweets, and the outer cloud contains the words most frequent in the comments, replies and retweets received by the candidate’s social media pages. The bigger the word in the cloud, the more frequent it appeared. The following figures show these What They Said x What They Heard word clouds.
Jon Ossoff (D)
His postings focused on attacking his opponent on alleged irregular stock sales and corruption. In addition, he focused on business, jobs, clean energy and health care. The comments Ossoff received focused mainly on corruption, Covid-19, health care, and stocks, followed by many other terms.
David Perdue (R)
Perdue’s posts emphasized business, jobs, taxes, supreme court, and attacked socialism and illegal immigration. The comments received talked about election fraud, the pandemic, covid-19, and attacked him about stock sales and corruption, among many other different topics.
Reverend Warnock (D)
Raphael Warnock posted mainly about the pandemic, business, and health care. He received comments about Covid-19, corruption, health care, racism, stocks, fraud and many others.
Kelly Loeffler (R)
Her postings focused on business, taxes, and the economy. The comments received talked about election fraud, Covid-19, stocks, corruption, taxes, the pandemic, and several other issues.
Using Social Media to Forecast the Election
Based on the polling results in the 2016 and 2020 elections, it has become clear that polls are no longer able to predict the actual outcome of the voting within a reasonable margin of error. In 2016, polls wrongly underestimated Donald Trump’s popularity in some states, which caused surprise with the subsequent outcome of the election (i.e., most polls had predicted Hillary Clinton would win). In 2020, many polls also underestimated Trump’s reach and predicted that Biden would take some of the battleground states with higher margins than he actually got. Polls did not get the final winner of the 2020 election wrong, but they got their numbers considerably off in some states.
No convincing explanation has been put forward for why polls seem to be getting less accurate in the last 2 presidential elections. Some say it is the behavior of the Trump voter, but many are not convinced this is an issue with the Trump constituencies, and point to more structural problems in polling.
Social media has established itself as an additional component that can help predict the outcome of elections, although it is not clear yet which social metrics work better. Early research based on the elections in New Zeland in 2011 and in Ireland in 2011 indicated correlation between election results and the size of the social networks as well as the amount of activity on the social networks of the candidates. Although this was the case for those elections, it is no longer the case today, as candidates, winners and losers, have amassed huge number of fans and followers as well as extremely high engagement. So, number of fans and engagement are no longer a reliable metric.
According to SocialMediaToday, looking at the 2020 presidential elections, comparing the absolute numbers of fans, engagement, likes and comments, between candidates is not an effective way of predicting the election outcome. It suggests that looking at recent growth of these metrics in isolation may better indicate momentum for one candidate or the other.
Our own studies, looking at the Brazilian presidential election of 2018, concluded that in polarized 2-sided elections, the daily incremental gain in number of fans and followers was a good metric that could be used to measure relative change in support of a candidate. (The results of this study were published in Portuguese).
We will used a similar method here to estimate the chances of each candidate in Georgia’s senate elections, and we will compare our numbers with the average poll numbers collected by the site FiveThirtyEight (updated on Dec/6).
This was our methodology:
- Get the numbers of votes received by each candidate in the first election, and compute the number of votes received by all other candidates
- We assume that the people who voted, in the first election, for Jon Ossoff, David Perdue, Reverend Warnock and Kelly Loeffler, will do so for the same candidate again in the runoff election.
- We assume that the number of undecided voters will be the sum of the votes for all other candidates, plus a number of new voters (who did not vote in the first round), something between 0 and 100 thousand. This may be a very rough estimate (or overestimate), but considering the stakes and the efforts by DEM and GOP to win the senate, we may see more people voting.
- We will distribute these undecided voters per day in the 2 weeks considered in this analysis, as if they were making up their minds, a few each day; and we will “assign” them to each candidate (in each race, separately) based on the percentage of new fans and followers that they acquired each day, as shown in the graphs above entitled “For each new 100 new fans and followers, how many go to each candidate per day?“
- To compare with the average poll numbers collected by the site FiveThirtyEight, we start off on the same day, November 23rd, with the same percentage points to each candidate. Then using the steps above we compute the gain/loss of each candidate daily. At the end of our analysis period, December 7th, we have the percentage points for each candidate, if the elections were held on that day.
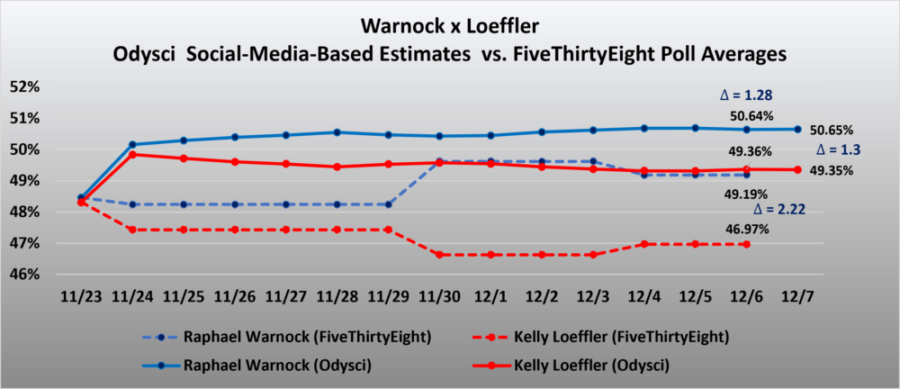
The figures below illustrate the values generated by our method, in comparison with the values collected by FiveThirtyEight.
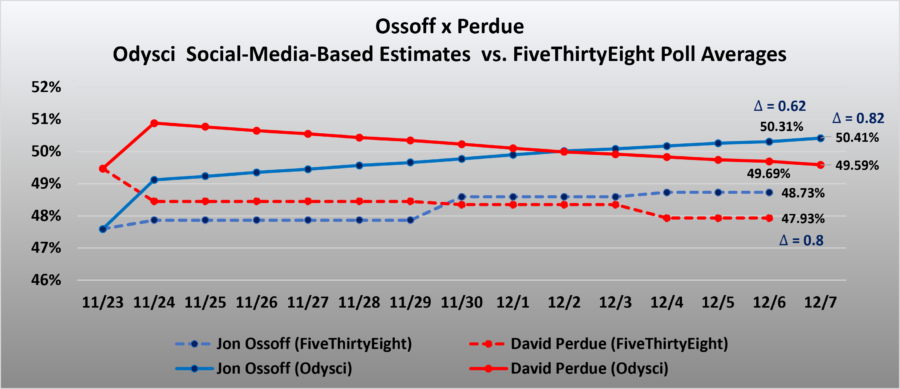
For the Ossoff vs. Perdue race, the poll average computed by FiveThirtyEight, says that on Dec 6, the difference between the candidates was 0.8%, whereas we came up with 0.62%.
For the Warnock vs. Loeffler race, the poll average computed by FiveThirtyEight, says that on Dec 6, the difference between the candidates was 2.2%, whereas we came up with 1.28%. One thing to note is that FiveThirtyEight percentages do not add up to 100% and ours do.
In both races the edge of one candidate over another is within the margin of error of election polls (usually 2% to 4%), so it can certainly go either way. Although this is a simplified analysis, without statistical rigor, we believe it shows actual trends of the electorate and could be used as validation or augmentation of other polling methods.
Wrapping Up
We looked at the main social media metrics of all four candidates in Georgia’s runoff senate elections, as of Dec/7. Here are the main takeways:
- Ossoff has the most combined number of Twitter followers and Facebook fans, followed by Warnock, Loeffler and Perdue.
- Between Nov/24 and Dec/7, Ossoff gained 66,824 new fans and followers, with Warnock in close second with 66,111. Loeffler is third with 50,766, and Perdue a distant fourth with only 16,039 new fans and followers.
- Considering the number of new fans and followers going to candidates in each race daily (between Nov/24 and Dec/7), Ossoff has consistently gained more than Perdue, about 81 to 19 (for each 100 new fans/followers). These values for Warnock and Loeffler are very different, with huge daily oscillations, and overall, for the period, Warnock gained 57 to Loeffler’s 43 (for each 100 new fans/followers).
- All four candidates published similar numbers of posts and tweets, with Loeffler being the most prolific. Ossoff and Warnock received the most mentions and replies on Twitter, with Perdue and Loeffler leading in comments received on Facebook. The engagement per 1000 fans/followers was the highest for Loeffler and Perdue on Facebook, in part because of their lower number of fans.
- Analyzing the actual words most frequent in their posts and tweets, as well as in the comments and replies received, we see a familiar pattern: Covid-19, Corruption, Fraud, Business, Pandemic, and Health Care were among the most popular, although the top one for each candidate varied.
- Finally, we used the incremental daily fans/followers counts to estimate the percentage gain or loss of voting intention for each candidate. Both races appear very tight on Dec/7 with Ossoff leading Perdue by 0.82%, and Warnock leading Loeffler by 1.3%.
We plan to post updates to the data presented here as we get closer to the election.
Odysci
Related posts


