Marketing and Competitive Analysis Based on Social Media Data
The link between social media and competitive analysis is not always obvious, and consequently it is not always explored to its full potential.
Social media allows a fantastic way of exchanging information. On the one hand, the company, its products, services, and employees, and on the other, its fans, customers, employees (yes, on both sides), detractors, competitors, etc. But to be really useful, both sides need to treat social media as a truthful means of interaction and exchange; and not just as a means of one-directional dissemination of information.
Competitive analysis, using data from social media, can be particularly useful, if done in a proactive, real-time manner. Instead of waiting for the end of the campaign to analyze your social media metrics, you can keep track of the data as it evolves. You can mine yours and your competitors’ social media data and correlate with current metrics, so you can determine what is working and what is not – and adapt current campaigns as needed or help plan future campaigns.
This article presents some insights on how to use social media data to compare marketing strategies with your competitors and use that to plan your campaigns. Throughout the article we will use examples of from the Odysci Media Analyzer tool for data collection, visualization, and data mining. For competitive analysis we will use only public data available from the social media pages.
Data collected from social media
The “raw” data present on social media includes several numerical metrics (e.g., number of posts, number of comments, etc.), the texts posted by the page owner, and the texts of the fans’ comments on the page. Each type of data can also be collected in different ways (e.g., total, daily, hourly, etc.) allowing different analyses.
Here, we will refer to “fans” as any user (not the page owner) who likes, follows or subscribes to a social media page on Facebook, Instagram, Twitter or YouTube. We will call “posts” anything posted by the owner of a social media page on Facebook, Instagram, Twitter and YouTube, and we will refer as “comments” to anything posted by any other user on those pages (as a comment on a post) or mentioning those pages (as a @mention on Twitter).
The vast majority of social media analysis tools collects numerical data and the posts; but only a few tools do the so-called “listening”, which is the collection of comments from fans on the page. An even smaller portion of the tools available on the market do data mining on the comments.
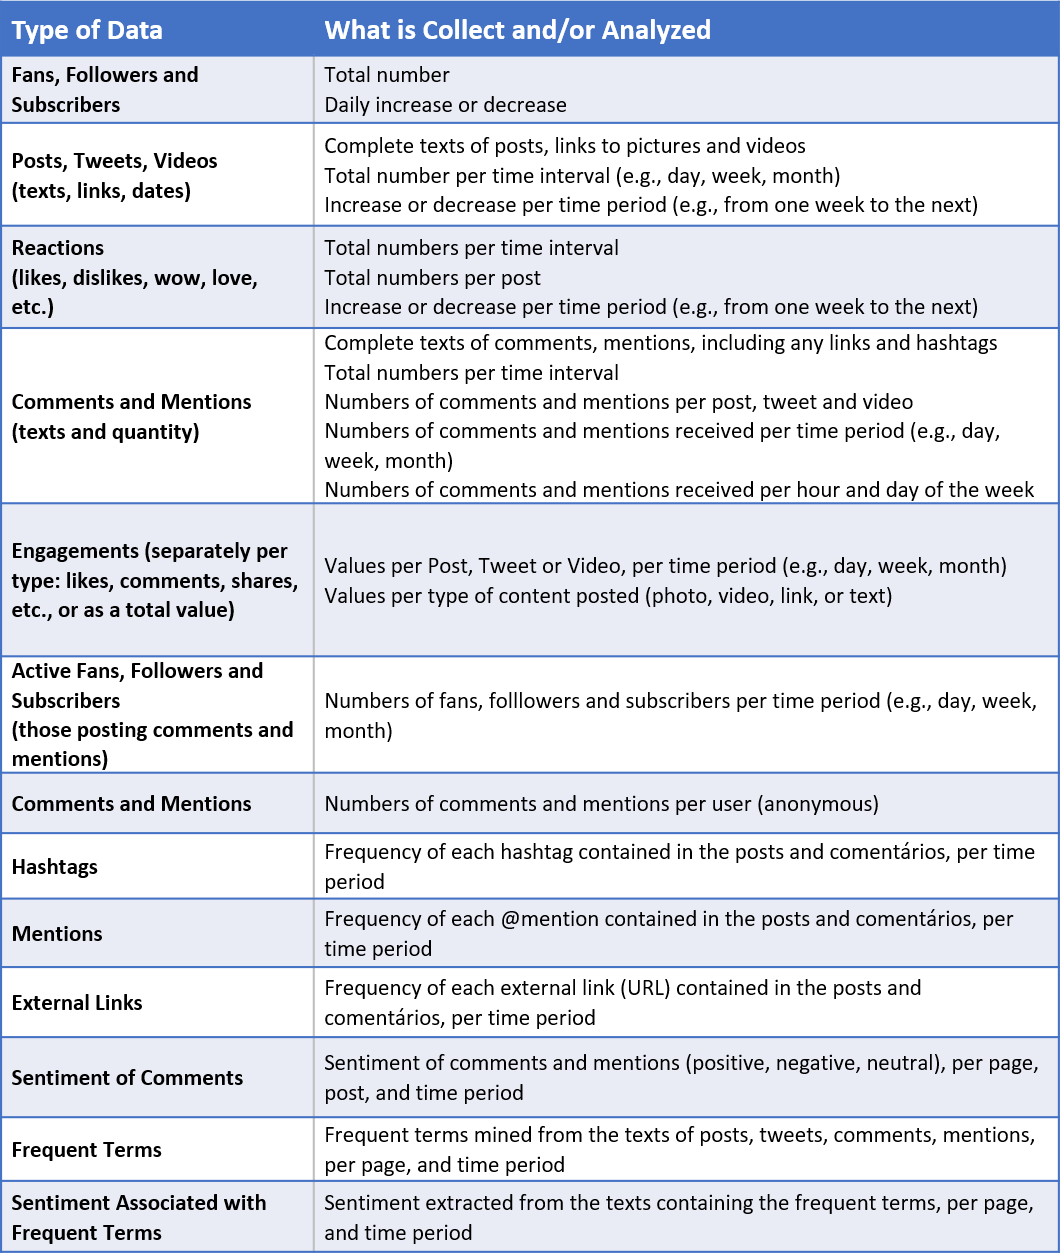
The table below summarizes the main public data, which can be extracted from businesses social media pages using the APIs provided by Facebook, Instagram, Twitter and YouTube, without the need for the login and password of the page owner, and without collecting any personal information from users of social networks. In addition to the types of data extracted, the table lists some main modes of collection and analyses that can be useful in comparisons between companies.
Main Indicators
There are many indicators that can be used to assess the content and engagement of companies in social media, and to compare them with their competitors. It is important to note that the indicators used must always be in line with your final return strategy.
You may have a social media strategy to increase the number of fans – but does it translate into greater brand reputation or greater income and profitability?
Social media can and should be used as a means to achieve a planned objective that reflects some kind of company improvement, be it higher earnings, or more people wanting to work for the company, or promoting a new product, etc.
Some of the main indicators are:
1. Fans, Posts and Comments
These three metrics are important to analyze together. The total number of fans is a good indicator of brand recognition. Posts, tweets and videos are used to publicize products, services and to interact with fans. The comments and mentions received reflect the fans’ engagement with the brand and the posts.
Let’s see an example of these metrics collected from the social media pages of the three main drugstore chains in the US, considering the period between December/1 and December/31/2020. We monitored Facebook, Instagram, Twitter, and YouTube, of Walgreens, Rite Aid, and CVS Health.
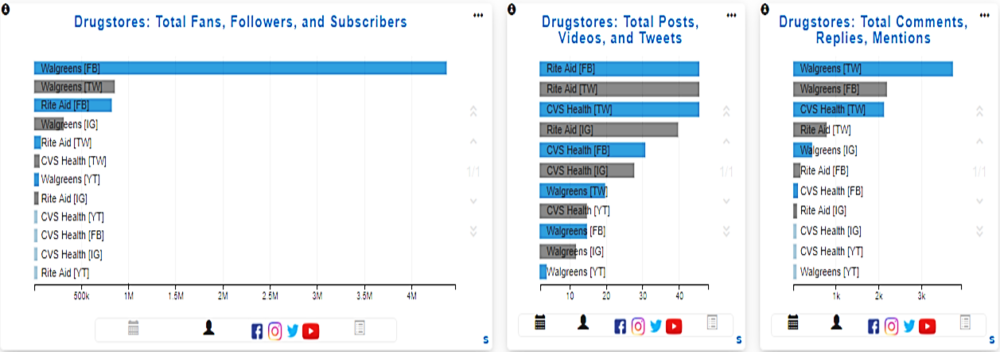
Walgreens FB (Facebook) has the most fans – over 4.46 million. Followed by Walgreens TW (Twitter) with 859K followers, and Rite Aid FB with 827K followers. CVS Health TW appears in 6th-place with only 61K followers.
Rite Aid FB is the profile that posted the most, with 48 posts in December/2020, followed by Rite Aid TW with 47 tweets, and CVS Health TW with 46 tweets. Walgreens TW appears in 7th-place with only 18 tweets in December, despite being second in fan/follower count.
Walgreens TW received the largest number of comments (3.9K) in December, followed by Walgreens FB (2.2k), CVS Health TW (21K), Rite Aid TW (791), Walgreens IG (Instagram, 448). The top six pages in number of comments received, matched the top six pages in number of fans/followers (although not in the same order). For these pages, the number of comments does not correlate with the numbers of posts made by the page owners. This indicates that the engagement on comments have more to do with the brand than with what the brand is saying through their posts. In many cases this may be a sign that users are complaining about something, and only a detailed sentiment analysis of the comments can reveal its true nature. We will see more about sentiment analysis later.
In addition to total number of fans, it is important to look at trends, that is, are the fans increasing or decreasing with time? The following figures illustrate this point, per page and per social network.
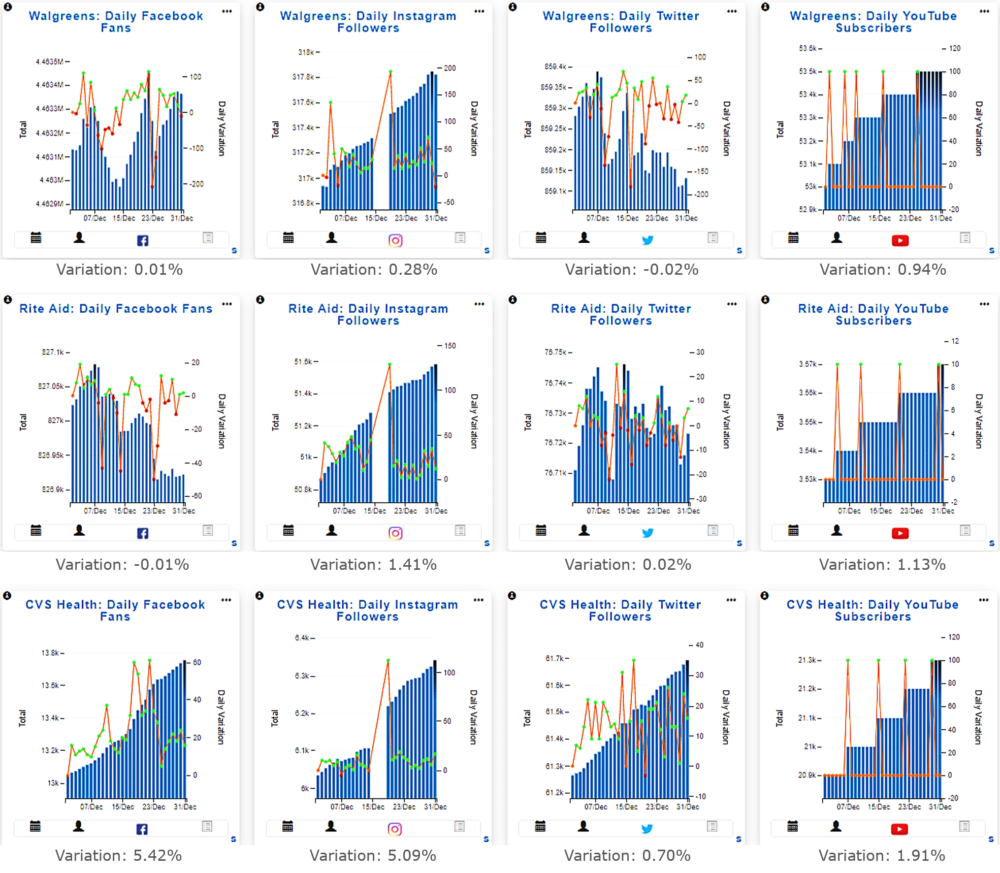
The figures above show the daily variation in the number of fans, followers and subscribers. The vertical bars show the total number for the day, while the orange lines show the daily variation (green dots represent increases, red dots represent decreases). Note also that while Facebook, Instagram, and Twitter report the fans and followers changes daily, YouTube, on the other hand, shows only discrete variations, in 10 or 100 subscribers at a time.
Although the increases are small, the only brand that consistently gained supporters in December was CVS Health. All its four social networks show a steady increase in numbers of fans, followers, and subscribers. The other brands, Walgreens and Rite Aid, show more modest gains and wider variations, and decrease in the cases of Walgreens Twitter and Rite Aid Facebook.
2. Fan Reactions to Posts
The success of a post is usually measured by the reactions of users, through likes, dislikes, loves, and other types of reactions, as well as the number of comments received in the post. Another important aspect in the evaluation of posts is the speed in which the posts receive the engagement of fans. The analysis of how fast fans react to a post can be decisive in a marketing campaign where, depending on the type of reaction of the fans, the message must be changed quickly.
Let’s analyze, for example, the evolution of likes and dislikes in two videos from the Apple YouTube page, as illustrated in the figure below.

Each colored line in these graphs represents a video posted in the Apple page and the points in each line represent the number of likes (on the left) and dislikes (on the right) received from the day of the posting to 2 days later.
Apple posted 2 videos about the Airpods Max on December/8 almost at the same time. One video had a lot more likes and dislikes than the other one, as shown above. The top video had 116K likes on December/8, climbing to 182K likes on December/9 and to 201K likes on December/10. On these same dates, this video had 6K, 23K and 30K dislikes, respectively. The second video had much lower numbers, reaching less than 60K likes and 4K dislikes. This was probably part of an A/B test where Apple wanted to see which type of advertising would resonate better with fans.
Let’s now look at the evolution of the number of comments received by posts in the Samsung US Facebook page.
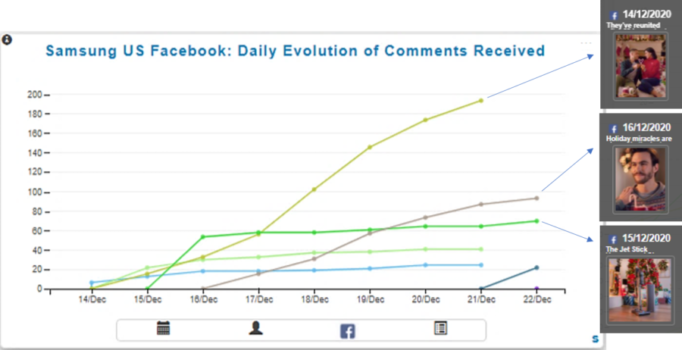
This figure shows 3 posts, made on Dec/14, Dec/15 and Dec/16. The Dec/14 post started slowly with only a few comments, but by Dec/21 it had amassed almost 200 comments (the higher for Samsung in December). The post on Dec/15 had a one-day surge to almost 60 comments, but it stayed almost flat for the next 7 days, reaching 70 comments by Dec/22. Finally, the post on Dec/16 started slowly but eventually overtook the Dec/15 post, reaching 93 comments by Dec/22.
These evolution-type analyses are critical to determine what is getting more attention by the users. Depending on the type of social network, the evolution needs to be tracked for a different number of days. On Twitter, the tweets have shorter attention spans than Facebook or Instagram posts, that is, users will “see” the tweet, and possibly react to it, within one or two days tops. Whereas for posts on Facebook or Instagram, the attention span may last for up to 7 days; and for YouTube videos, the attention span may be even longer. It also depends on how many posts, tweets and videos the page publishes – too many publications may dilute reactions and make fans less attentive.
For the purpose of comparing your marketing campaigns with your competitors, it is important to understand the market segment your company is in and identify your main competitor (perhaps more than one). Once this is done, you can select your main metrics for comparisons, according to your campaign objectives.
In the previous paragraphs we presented the evolution graphs of likes, dislikes and comments for the publications of Apple and Samsung. Within the Odysci Media Analyzer, these companies belong to the market segment called “Smartphones US”, which includes the pages of Samsung, Motorola, LG, and Apple on the four main social networks if existing (Facebook, Instagram, Twitter and Youtube). The Odysci Media Analyzer monitors these pages and produces a summary of each page, compared with the average of the market segment. The figure below shows the details.
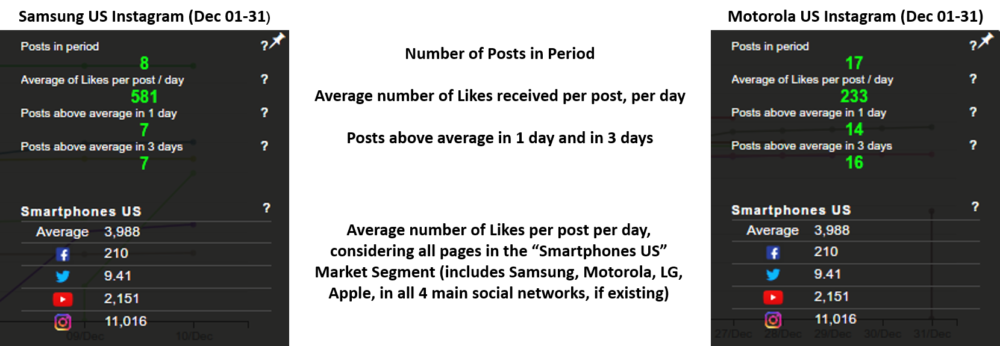
In this figure, the top of each image shows the page averages, and the bottom shows the market segment averages. For example, the Motorola US Instagram page (right side in the figure) made 17 posts in the indicated period (December 1 to 31), with an average of likes received per post per day of 233. Of these 17 posts, 14 received more likes than the average (233) in a single day, while 16 posts exceeded the average in 3 days, and one post did not reach the average number of likes in 3 days.
In the same period, Samsung US Instagram page (left side in the figure) made 8 posts, and, on average, each post received 581 likes per day. Of these 8 posts, 7 exceeded the average of likes received in 1 day, and no other post exceeded the average even in 3 days. On both cases, the majority of posts exceeded the average likes on the first day.
Regarding the segment averages, the bottom of the images shows that the pages monitored in this segment (Samsung, Motorola, LG, Apple) had, on average, 3988 likes per post per day. Considering only Instagram pages, the average was 11016 likes per post per day.
A brand can use this information to compare their campaigns with their competitors’ campaigns. By analyzing the topics of the posts and their engagement speed, you may change or adapt the campaign to better engage the audience.
3. Data Mining and Sentiment Analysis
In addition to numerical metrics, it is important to “listen” to comments posted by fans. This is both a qualitative and quantitative analysis which can be automated by text mining of relevant terms and the detection of sentiments associated with these terms. This type of detailed analysis allows:
- Discover brand strengths and weaknesses as seen by fans
- Compare similar terms between different brands in the same market segment
- Respond and adjust your campaigns to negative comments, and reinforce the message in case of positive comments
- Check if many negative comments are from the same fan, and filter or respond appropriately
Let’s consider the US mobile carriers market segment, specifically AT&T, T-Mobile and Verizon. By listening to the comments on the Facebook, YouTube and Twitter pages of these carriers, we can extract a list of the most frequent relevant terms, and analyze the sentiment associated with the comments. This allows us to quickly see the strengths and weaknesses of the carriers, from the point of view of the fans and followers.
The figure below illustrates this type of analysis. The chart on the left shows the 10 most frequent terms extracted from the fans’ and followers’ comments on the social media pages of the 3 carriers, during the period from December 1 to 31, 2020. The 10 terms were, in decreasing frequency: “Customers”, “T-Mobile”, “AT&T”, “5G”, “Customer Service”, “Internet”, “Family”, “Bill/Billing”, “Verizon” and “Children”.
The chart on the right shows the sentiment associated with the comments containing the terms. We can see, for example, that the top bar shows the term “Customers” present in 4027 comments, where 43.4% of them being negative. The 8th bar from the top shows the term “Bill” present in 1350 comments, with 35.1% of them being negative.

These charts give us an overview of the relevant terms and sentiments for the market segment as a whole. We can now look in more detail at any aspect we choose and see how they fare with each carrier. Let’s consider the two terms mentioned above: “Customers” and “Bill/Billing”. The table below shows how negative the comments containing these terms were on the pages of each carrier.

The AT&T fans and followers were the most critical. Of all comments posted to AT&T social media pages containing the term “Customers”, 53.6% were negative (usually complaints about customer service). Similarly, 50.7% of all comments containing the terms “Bill” or “Billing” were negative (usually complaints about billing errors). In these aspects, AT&T had the most complaints (as percentage of negative comments), followed by Verizon, and then T-Mobile with the least percentage of complaints.
Wrapping up
Any interaction between your company and its fans or detractors on social media is relevant data that can be analyzed either individually or as a whole. Individually, you may want to check who are the users who make tens of comments, complaining about something, and reply to them. Overall, you may want to check what most customers are complaining about your product and do something about it.
The important metrics to be analyzed (e.g., fan growth, number of likes, etc.) should be chosen according to the main objectives of the marketing campaign and/or the company. A campaign to promote a new product can measure shares and likes of posts. A campaign to promote the brand, on the other hand, can measure the number of positive comments associated with the brand and compare with the competitors.
In this article we presented some ideas on how to use social media data to evaluate your marketing strategies and those of your competitors. We showed the types of data that can be extracted from social media and some indicators that must be monitored. The list is extensive and this article covered only some of them.
The amount of data available and the direct interaction with fans make social media monitoring and listening, a vital component in your marketing strategy and competitive analysis. Automated software tools like the Odysci Media Analyzer and others must be an essential part of your marketing toolbox.
Odysci
Related posts
