Predicting Georgia’s Runoff Elections Using Social Media (Dec/21st)

The last two, yet undecided, US Senate seats will be chosen by Georgians on January 5th. Given the accuracy of the polls (or lack thereof) on predicting the outcomes of the November elections, no one really knows which way the electorate is tending to. The lack of reliable polls is forcing the candidates to rely less on poll numbers, and concentrate on their own messages, fending off attacks, and turning out voters.
Continuing our previous analysis of the candidates’ social media accounts, we will present updates to their social media data as of December 21st, and use a simple metric based on the relative number of new fans per candidate to estimate the percentage of likely votes to each candidate. We used the Odysci Media Analyzer to monitor the social media pages on Facebook and Twitter of Jon Ossoff (D), David Perdue (R), Reverend Raphael Warnock (D) and Kelly Loeffler (R). We collected daily data for four weeks between November 24th and December 21st.
Fans and Followers
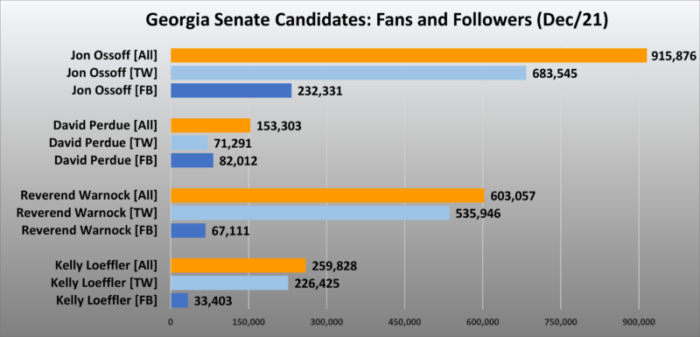
Let’s begin by revisiting the total number of fans and followers of each candidate on Facebook and Twitter, as of December 21st at 10am EST. The relative positions remained the same as in our previous analysis on Dec/7, although David Perdue and Kelly Loeffler had significant gains on Twitter (as a percentage of their Dec/7 values).
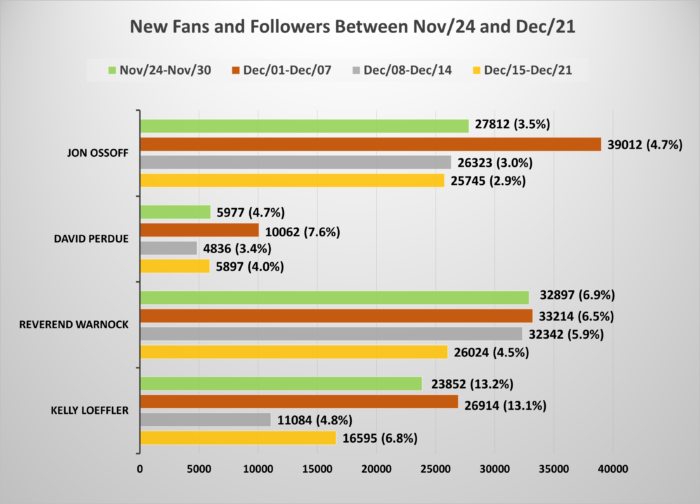
The figure below shows the number of fans and followers that each candidate gained in each of the past four weeks, and the percentage increase over the base number at the beginning of each week. During the weeks of Dec/08-Dec/14 and Dec/15-Dec/21, all candidates gained fewer fans and followers when compared to the previous two weeks, both in absolute terms and percentually. Warnock was the leader in the last two weeks, followed by Ossoff, then Loeffler and lastly, Perdue.
We also compared the percentage of new fans and followers going for each candidate. For example, for each 100 new people who started following any of the candidates, how many followed each candidate? The following figures look into these numbers pairwise for each senate race for the last four weeks.
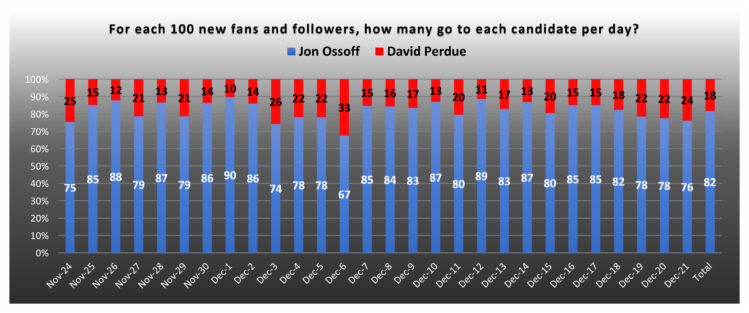
The figure above breaks down the distribution of new fans and followers for both candidates, Jon Ossoff (D) and David Perdue (R), between November/24 and December/21, as well as the total in the period. For example, on Dec/15, for each 100 new fans and followers we had 80 following Jon Ossoff (D) and 20 following David Perdue (R). Although there are some daily fluctuations, Ossoff is clearly maintaining a steady lead on the percentage of new fans gained daily. Overall, for the last 4 weeks (up to Dec/21), for each new 100 fans and followers, 82 sided with Jon Ossoff (D) and 18 sided with David Perdue (R).
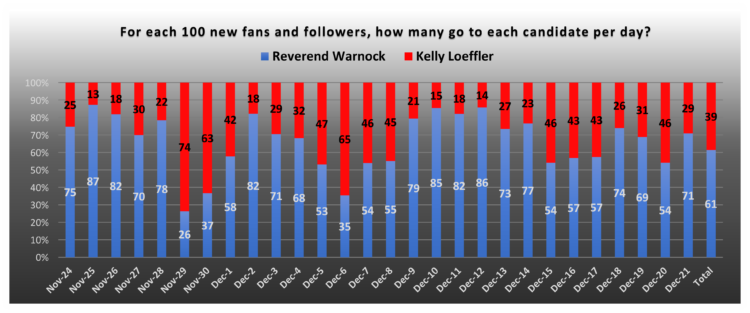
The figure above shows the same metric for candidates Reverend Warnock (D) and Kelly Loeffler (R). For example, on Dec/17, for each new 100 fans and followers we had 57 following Reverend Warnock (D) and 43 following Kelly Loeffler (R). In this race, we see strong fluctuations from one day to the next, but it seems that after Dec/6, Reverend Warnock was able to keep the lead, although not always by high margins. Overall, for the last 4 weeks (up to Dec/21), for each new 100 fans and followers, 61 sided with Reverend Warnock (D) and 39 sided with Kelly Loeffler (R).
Using Social Media to Forecast the Election
We developed a methodology that starts with the number of votes received by each candidate in the Nov/3 election, considering all candidates that ran for the Georgia US Senate seats (regular and special elections). Then using these numbers of votes, and the percentage numbers of new fans and followers that candidate gathered in the last four weeks, we predict the likely percentage of votes that each candidate would receive if the election were held on Dec/21. Details of the methodology are as follows:
- Get the numbers of votes received by all candidates in the first election (Nov/3). We will assume that all voters that cast a valid vote on Nov/3 will do so again on Jan/5.
- We assume that the people who voted, in the first election, for Jon Ossoff, David Perdue, Reverend Warnock and Kelly Loeffler, will do so for the same candidate again in the runoff election.
- In the regular election, besides Ossoff and Perdue there was only one other candidate, Shane Hazel, a LIbertarian, who got about 115 thousand votes. For now, we will consider these 115 thousand voters as undecided, but people who will vote again on Jan/5.
- In the special election, besides Warnock and Loeffler, there were 18 other candidates, from various parties. We will now “reassign” the votes for those 18 candidates to Warnock or Loeffler. We will assume that a high percentage (90%) of people who voted for a Democratic candidate will transfer their vote to Warnock, and the same percentage of people who voted for a Republican candidate will vote for Loeffler. The 10% remaining from each group of voters (pro Democratic or pro Republican) will be considered as undecided, or people who may switch camps. The people who voted for candidates in other parties (Libertarian, Green, Independent) will all be assumed to be undecided.
- We assume that the number of undecided voters, in each election, will be the sum of the undecided voters as explained in steps 3. and 4. above, plus a number of new voters (who did not vote in the first round), which we will assume to be 75 thousand. This estimate is based on the number of new voter registrations between Nov/3 and Dec/7 (registration deadline).
- Based on the steps above, we estimate the number of undecided voters in the regular runoff election as 190 thousand, whereas for the special election we estimate the number of undecided voters as 376 thousand.
- We will distribute these undecided voters per day in the 4 weeks considered in this analysis, as if they were making up their minds, a few each day; and we will “assign” them to each candidate (in each race, separately) based on the percentage of new fans and followers that they acquired each day, as shown in the graphs above entitled “For each new 100 new fans and followers, how many go to each candidate per day?“
The figures below illustrate the percentage of likely votes per candidate, per day, and the final value for the regular and special elections if they were held on Dec/21. The inicial percentages on Nov/23 are based on the numbers of votes that each candidate received on Nov/3, plus voter migration as explained in step 3. and 4. above.


For the Ossoff vs. Perdue race, we estimate that Ossoff leads Perdue by 0.66 percentage points on Dec/21. For the Warnock vs. Loeffler race, our estimate shows Warnock leading Loeffler by 1.40 percentage points on Dec/21.
This is a simplified analysis using the results of the first election (Nov/3), a few assumptions about voter migration and new undecided voters, and the relative gain of new fans and followers by each candidate on Facebook and Twitter in the last 4 weeks. In both races the edge of one candidate over another is within the margin of error of election polls (usually 2% to 4%), so it can certainly go either way. Although this analysis lacks statistical rigor, we believe it shows actual trends of the electorate, and could be used as validation or augmentation of other polling methods.
We plan to post one more update on the eve of the election on Jan/5.
Odysci
Related posts


